The paper LBO is a dreaded part of the private equity recruiting process. It’s also unfortunately one of the most common interview questions you’ll receive. But don’t worry, once you practice a few of them you’ll be cranking out LBOs in no time.
What Is a Paper LBO?
A paper LBO is a slimmed down version of an LBO model that can be calculated using pen and paper, typically within 5 to 10 minutes. You’ll be required to do all of your math in your head and on the paper, with no access to Excel or a calculator.
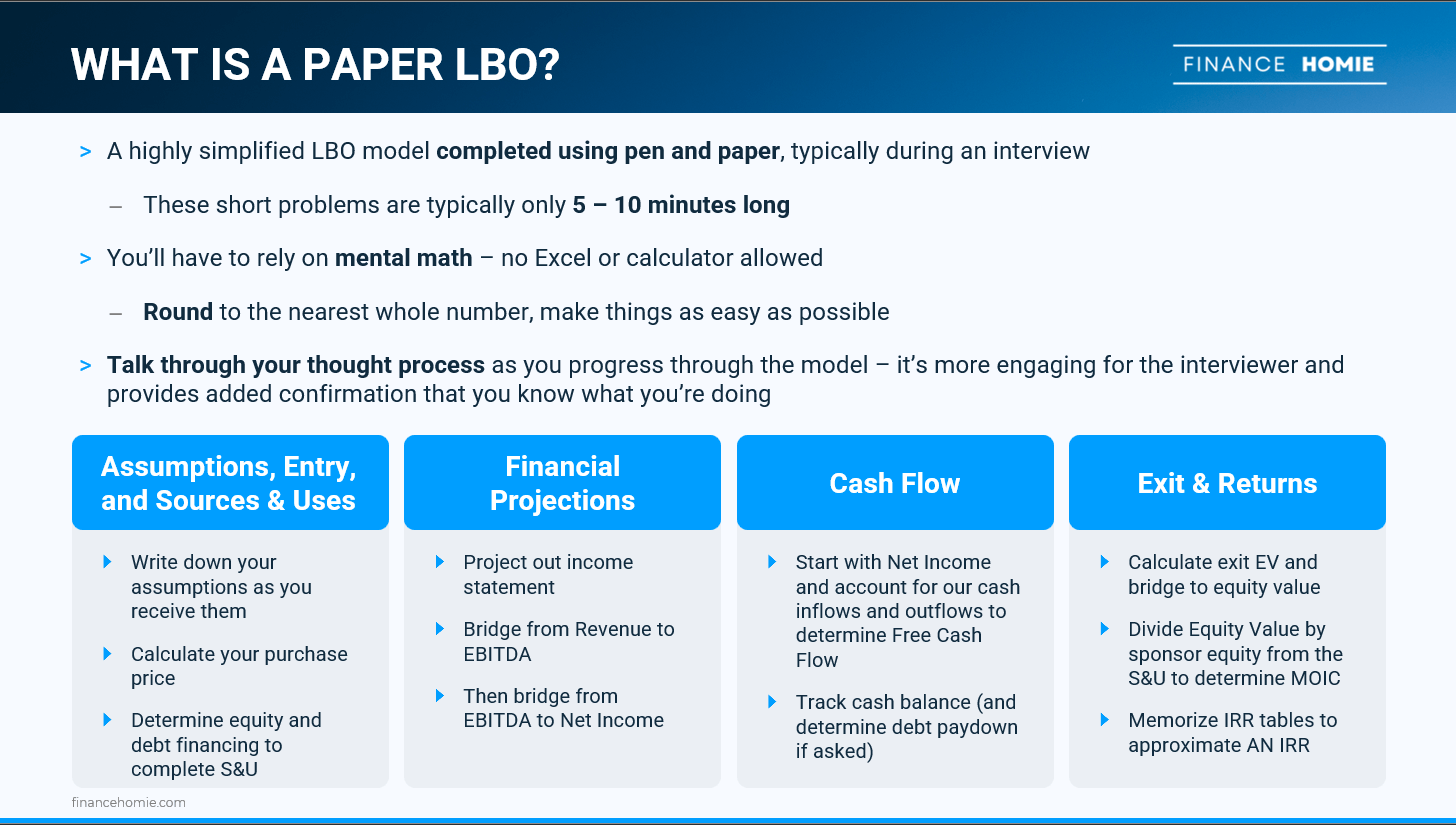
On the bright side, most paper LBOs are highly simplified, skipping things like transaction fees and debt repayment to focus only on the most critical drivers of returns: entry, exit, and EBITDA growth.
Most private equity firms will ask you to complete a paper LBO in the early rounds of interviews, prior to any full Excel-based model tests or case studies. It’s an easy way to check the box to make sure you have a basic understanding of the LBO model, as well as an opportunity to see how you perform under pressure.
Five Key Steps to the Paper LBO Model
- Transaction Assumptions & Entry
- Write down your assumptions as you receive them (the information you get from your interviewer or the test prompt)
- Calculate your purchase price, typically your LTM EBITDA (x) your Entry Multiple.
- Sources & Uses
- The Sources & Uses section of the model provides an overview of the purchase and financing of our investment (acquisition of the target company)
- The Sources (where our money is coming from) must equal our Uses (where our money is going)
- Our Uses will be equal to the purchase price we calculated in Step 1, plus any financing or transaction fees (which are less common in Paper LBOs but will always be present in full-length LBOs)
- For our Sources, first multiply our leverage multiple by our EBITDA to determine our debt financing
- The remaining cash need will be our sponsor equity (our own dollars) – this equity acts as a plug between the fixed debt financing we’ve received (based on our leverage read) and the full amount of Uses we need to match in order to complete the transaction
- Income Statement & Financial Projection
- Project out our income statement for the hold period (3 – 5 years) based on our provided assumptions
- Bridge from Revenue to EBITDA (subtract out any direct or indirect expense)
- Some more simple paper LBOs may skip the revenue to EBITDA buildup entirely, providing you an LTM EBITDA and an annual EBITDA growth rate
- Then, bridge from EBITDA to Net Income, accounting for D&A, Interest Expense, and Taxes
- Cash Flow Calculation
- Start with Net Income and account for our cash inflows and outflows to determine Free Cash Flow
- From Net Income, add back our D&A from the Income Statement, subtract our CapEx, and account for our change in Net Working Capital (NWC)
- Note that an increase in NWC from the prior period will be a negative as it’s a use of cash, while a decrease will be a positive source of cash
- Sum each year’s cumulative Free Cash Flow to determine our cash balance, which we’ll need in the next step
- Exit & Returns Analysis
- Multiply our final year EBITDA by our Exit Multiple to determine our Exit Enterprise Value (the same calculation we used to determine our initial purchase price)
- Then, subtract our Net Debt (Cash less Total Debt) from our Enterprise Value to determine our Exit Equity Value
- Divide our Exit Equity Value by our sponsor equity from the Sources and Uses to determine our MOIC (our cash returned from the investment vs. the cash invested in the first place)
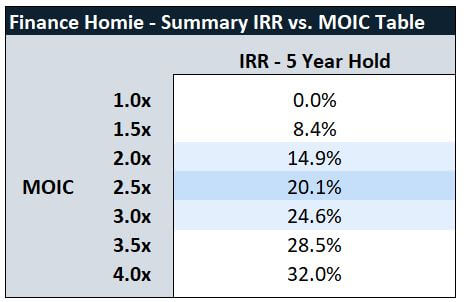
- Memorize IRR tables to triangulate an approximate IRR, shown below
- You won’t be able to calculate IRR using mental math, but you can approximate it based on your MOIC and number of years in the transaction
The Finance Homie Paper LBO Generator
If you’re already cranking out paper LBOs and just looking for some more practice, you’re in luck. We pulled together a paper LBO answer key generator so you can practice as many as you could possibly want.
No need to Google around for more practice tests — just pick some assumptions for yourself, knock out the LBO, and check here to see if you got the right answer.
A Paper LBO Example
If you’re not quite ready for the generator, let’s dive right in and work through a paper LBO together. Grab a pen and notebook and take a crack at it. Eventually you should be able to complete this within 5 to 10 minutes, but don’t worry if it takes a bit longer on your first try.
It’s important to note that you should always round your calculations to the nearest whole number. Trying to do more complicated math won’t impress the interviewer or change the answer, but will take longer and open you up to more errors.
Transaction Assumptions
The first part of the paper LBO will be recording the transaction assumptions you’re given by the interviewer. Write these down as you hear them because it’s easy to misremember something, or forget entirely.
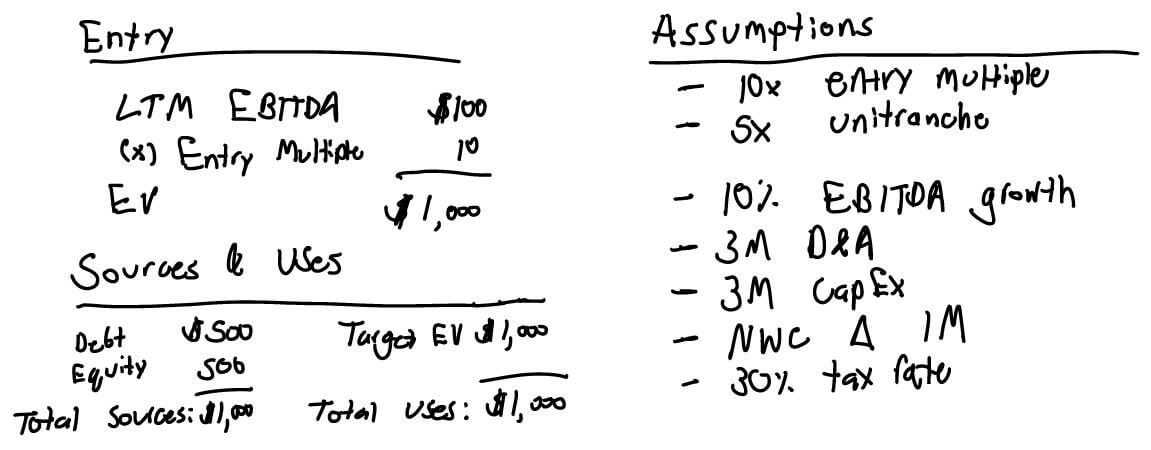
- Entry multiple of 10.0x on LTM EBITDA
- 5.0x unitranche debt with a 10% interest rate and no repayment/prepayment
- No transaction fees or financing fees
Historical Financials
Next, the interviewer will provide you with summary historical financials. It may be only EBITDA, or it may include revenue as well. More advanced paper LBOs can also feature a price and volume revenue build.
- LTM EBITDA of $100M
Financial Projections
Our next set of provided assumptions will guide our projections through the hold period. As we’re only working with EBITDA in this simple example, we’ll just use an EBITDA growth rate alongside our operating assumptions. More complex tests will provide revenue growth and margin assumptions.
- Assume EBITDA growth of 10% YoY
- D&A is $3M per year, held constant through the hold period
- CapEx is $3M per year, held constant through the hold period
- Assume an annual increase in net working capital of $1M
- Assume a 30% tax rate
Exit Assumptions
Our final set of assumptions will cover our exit, or sale of the business after the hold period.
- Exit after a five year hold period
- Assume an exit multiple of 10.0x on LTM EBITDA
Building Out the Paper LBO
Now let’s apply our five key steps to this prompt to get to an answer. Grab an Excel version of the model below (including prompt and answer key) to follow along if my handwriting is too unreadable.
Password: FinanceHomieTest
1. Transaction Assumptions & Entry
- Nothing too complicated here, just write down your transaction assumptions as you receive them
- Calculate your purchase price, which will be your LTM EBITDA multiplied by your entry multiple (10 x $100M)
2. Sources & Uses
- The next step is to calculate your Sources & Uses for the transaction
- We know our Uses contains the $1,000M purchase price and because we have no financing or transaction fees there’s nothing else to add
- Next, let’s calculate our debt — we have 5.0x leverage on $100M of LTM EBITDA, so will have total debt financing of $500M
- Our equity will comprise the remainder of our sources, so will be equal to our Uses less our debt financing ($1,000M – $500M = $500M of sponsor equity)
3. Financial Projection
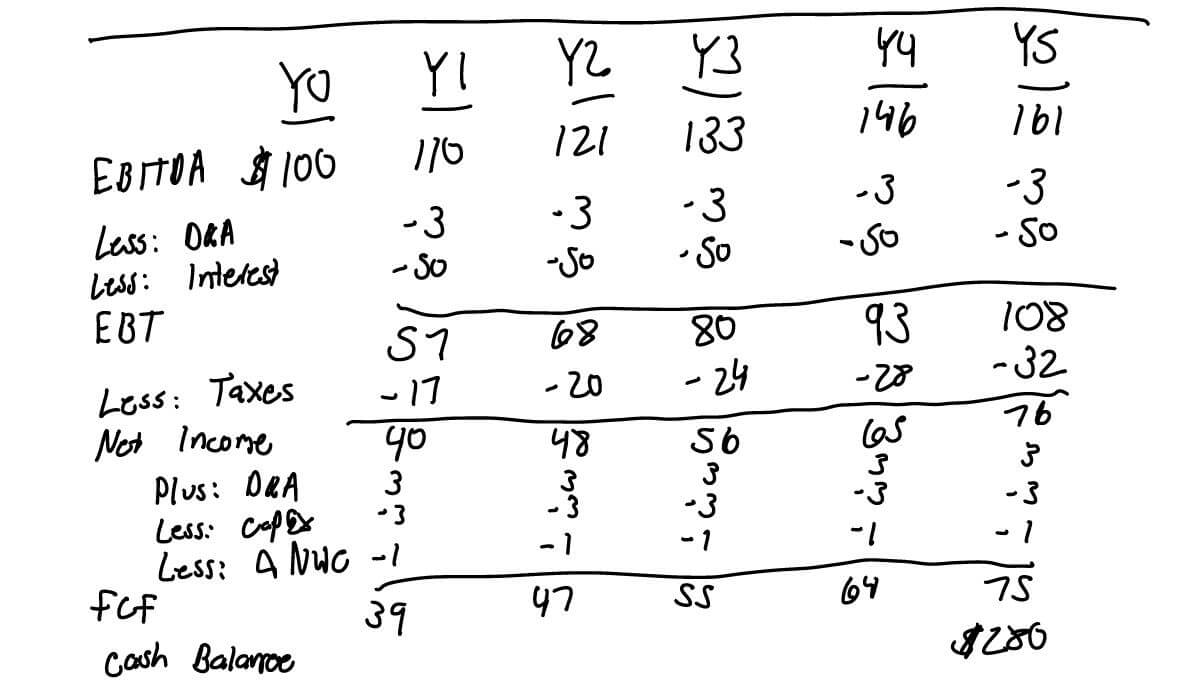
- Sketch out the years through the hold period, starting at Year 0 for the LTM period and then continuing with Years 1 through 5
- Place our LTM EBITDA of $100M in Year 0
- Grow this value out by 10% for each year thereafter, ultimately reaching $161M by our exit in Year 5
- From EBITDA, subtract D&A and interest expense to arrive at Earnings Before Tax (EBT)
- Calculate our taxes, multiplying our 30% tax rate by our EBT
- Subtract our taxes from our EBT to arrive at our Net Income

4. Cash Flows
- Now we need to bridge from our Net Income to our Free Cash Flow
- From Net Income, add back our D&A (non-cash expense), subtract CapEx, and subtract our change in net working capital to arrive at our Free Cash Flow
- Because we’re not paying back debt in this example, all of our Free Cash Flow will contribute to increasing our cash balance
- At Year 5, calculate the sum of Free Cash Flow from every year to determine our cash balance at exit
5. Exit & Returns Analysis
- Now that we’ve projected through exit, we can calculate our proceeds from the investment and our returns
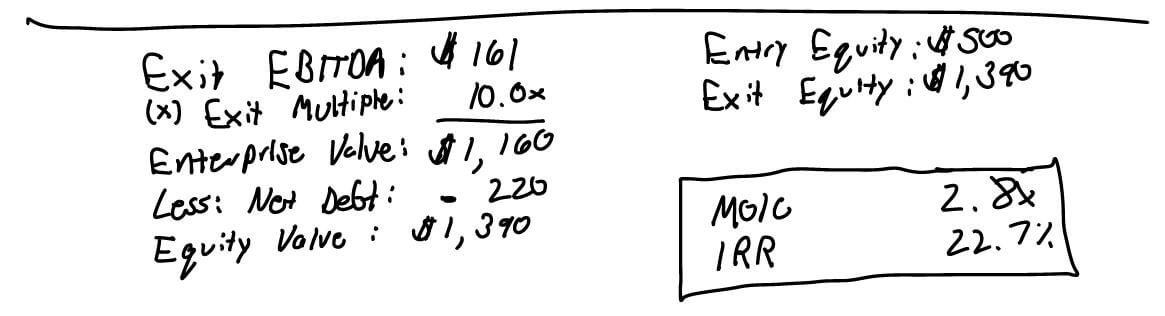
- Multiply our Year 5 EBITDA by our exit multiple to determine our Enterprise Value at Exit ($161M x 10 = $1,610M) (ignore my dyslexia in the snip below)
- From our Enterprise Value, subtract our net debt (Net Debt = $500M of debt less $280M of cash) to arrive at our equity value, or proceeds to the sponsor (us, the private equity firm)
- Our equity value equals $1,390M ($1,160M – $280M)
- To calculate our MOIC, divide our equity value of $1,390M by our equity contributed at entry ($1390M / $500M = MOIC of 2.8x)
- The exact calculation of our IRR is 22.7%, but for a paper LBO you should triangulate to an approximate IRR based on memorization of the IRR table
Wrapping Up
If you’ve mastered the easy example here, head over to the Finance Homie Private Equity Recruiting Course to access a full suite of paper and Excel LBO model tests (alongside an interview guide and full video course).
Now with paper LBOs in the bag, you’ll be covered for the most common hurdle used in the private equity recruiting process.